

How are the X Account Analysis metrics calculated?
Every figure in the report is calculated by Circleboom from official X API records. Circleboom is an Official X Enterprise Developer, so the report doesn't rely on scraped data.
Which period does each section cover?
- Engagement summary: averages per tweet over your last 90 days.
- Posting consistency: your last 30 days.
- Posts per day: Lifetime Average compared with Last 30 Days Average.
- Over-time charts: month by month.
- Audience sections: your followers and following on the analysis date.
If you post rarely, a period may include only a few tweets. Check how many tweets an average is based on before you read it.
How to read the main metrics
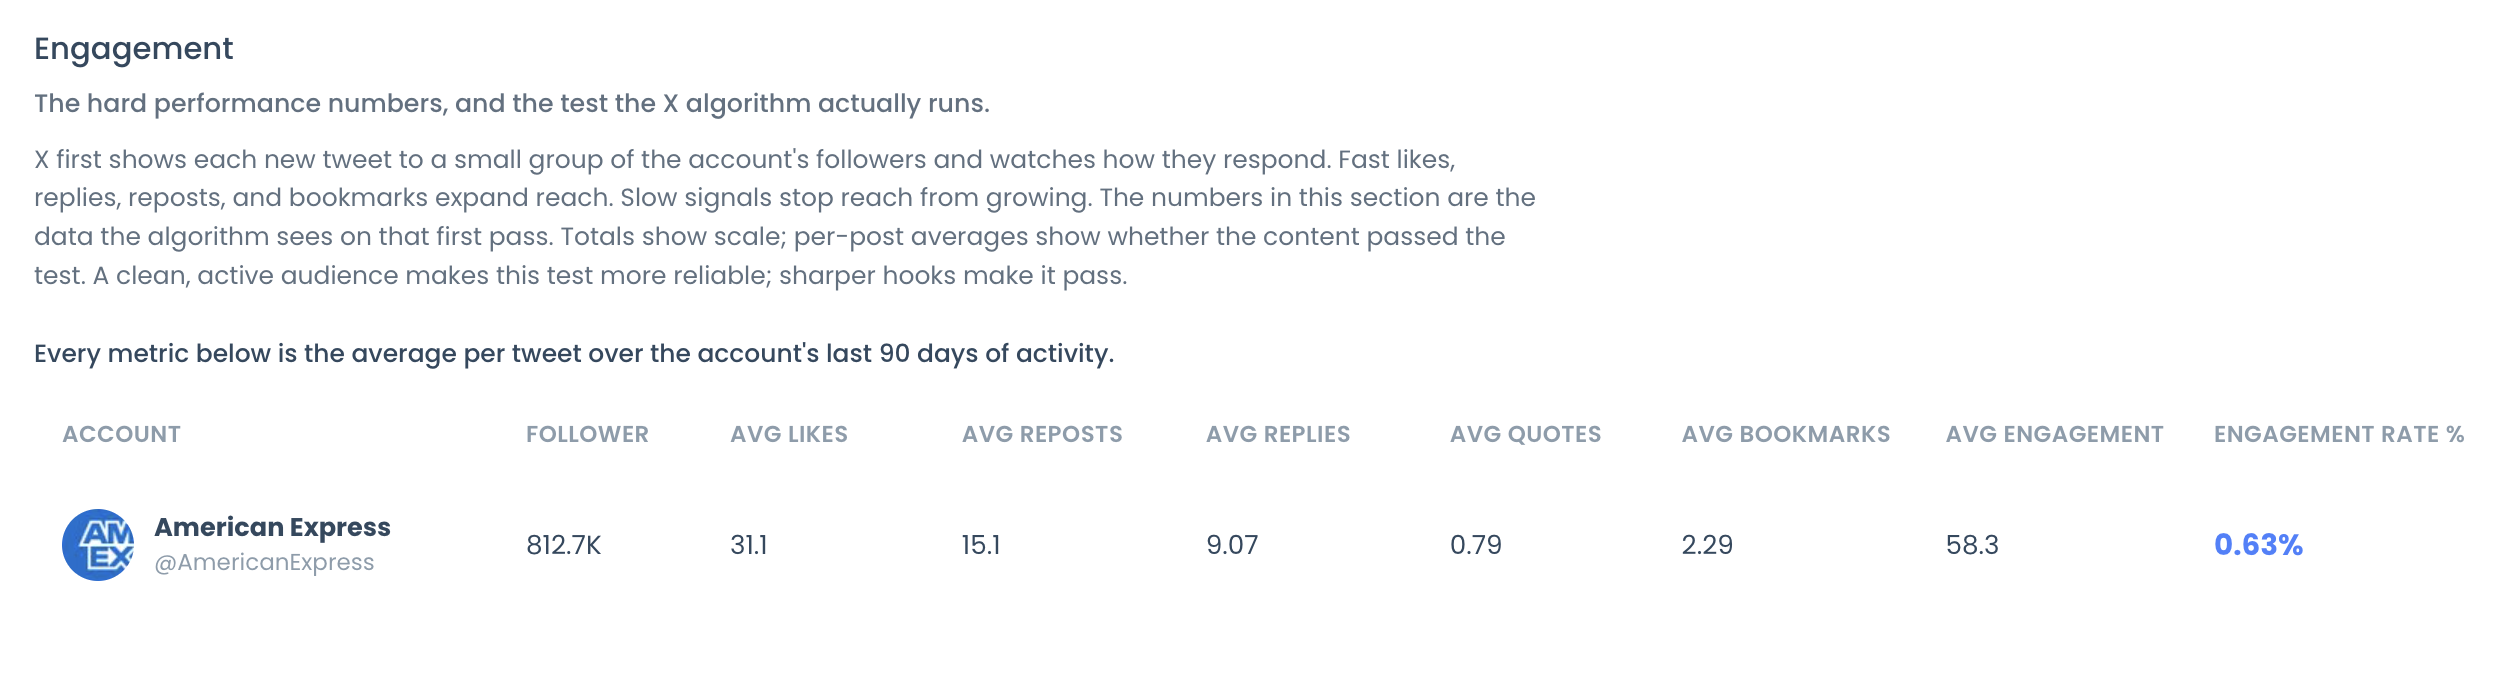
- Engagement rate: total engagement divided by total impressions. It is not based on follower count.
- Engagement table: AVG LIKES, AVG REPOSTS, AVG REPLIES, AVG QUOTES, AVG BOOKMARKS and AVG ENGAGEMENT are averages per tweet. Monthly totals appear in the over-time charts.
- Active followers: the share of followers classified as active based on their average tweeting frequency. It measures posting activity, not whether people read your tweets.
- Fake/Bot: accounts with bot-like signals. Treat it as a signal to review, not as a final verdict on an account.
- Hashtags: shown as average hashtags per 500 tweets.
- Average post length: shown as a range, for example "Typically posts between 18 and 1660 characters", not as a single number.
- Posting consistency: labeled Steady or Burst with a CV score. A higher CV means spikier posting.
- Posting-vs-audience timing alignment: a visual overlap of your posting times and your audience activity, not a numeric score.
- Gender and language: calculated from profile data in the official X API records. They describe your audience as a group, not any single account.