

What's included in the X Account Analysis report?
1. The essentials at a glance
Followers, following, active followers, account age, engagement rate and average impressions.
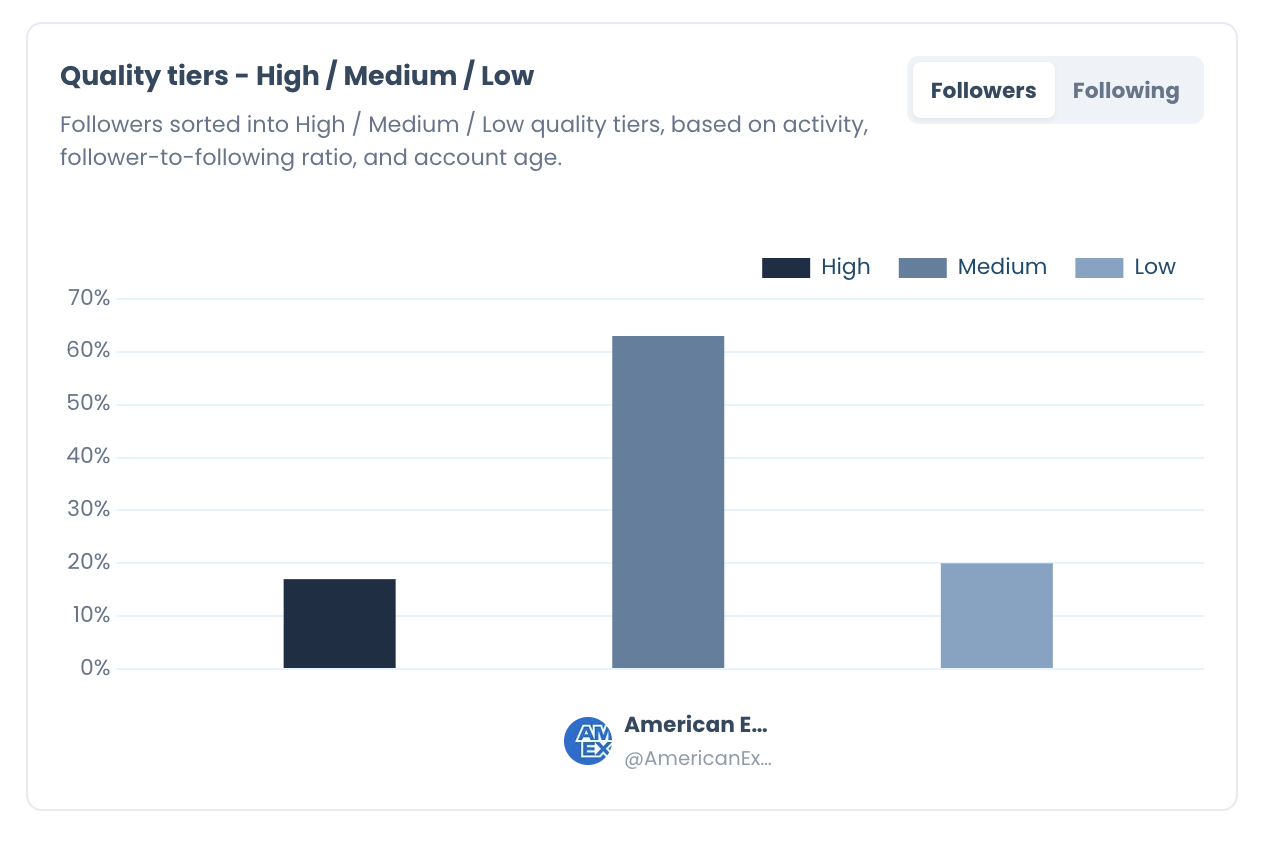
2. Audience Quality
Human vs Fake/Bot, Active vs Inactive, Ordinary vs Overactive, verified followers by badge type and quality tiers (High, Medium, Low), with the accounts behind the numbers.
3. Audience Demographics & Geography
Geographic distribution, time zones, languages, gender, audience active times and audience bio keywords.
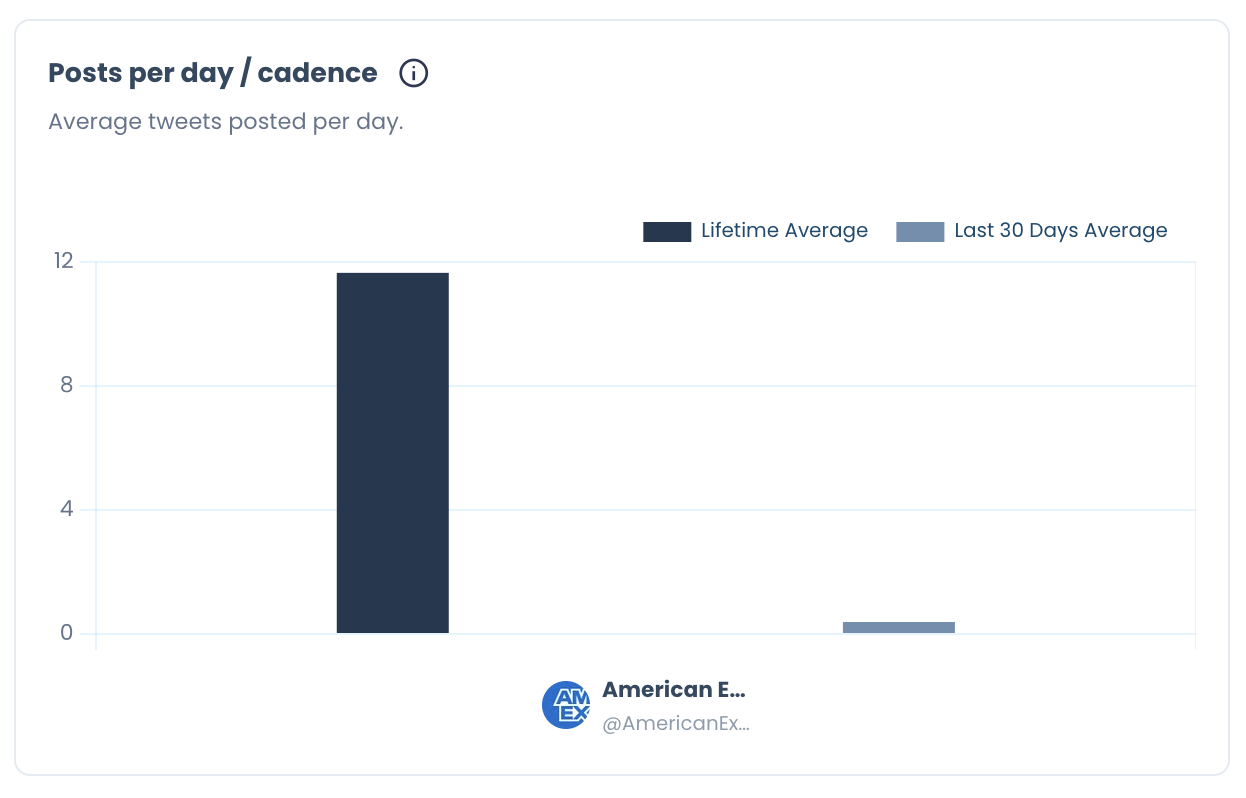
4. Posting Behavior
Posts per day (Lifetime Average and Last 30 Days Average), posting consistency, posting time-of-day pattern, average post length and posting-vs-audience timing alignment.
5. Content Type & Format
Post format distribution, top-performing format, the Original / Reply / RT / Quote mix, link and media share, and average hashtags per 500 tweets.
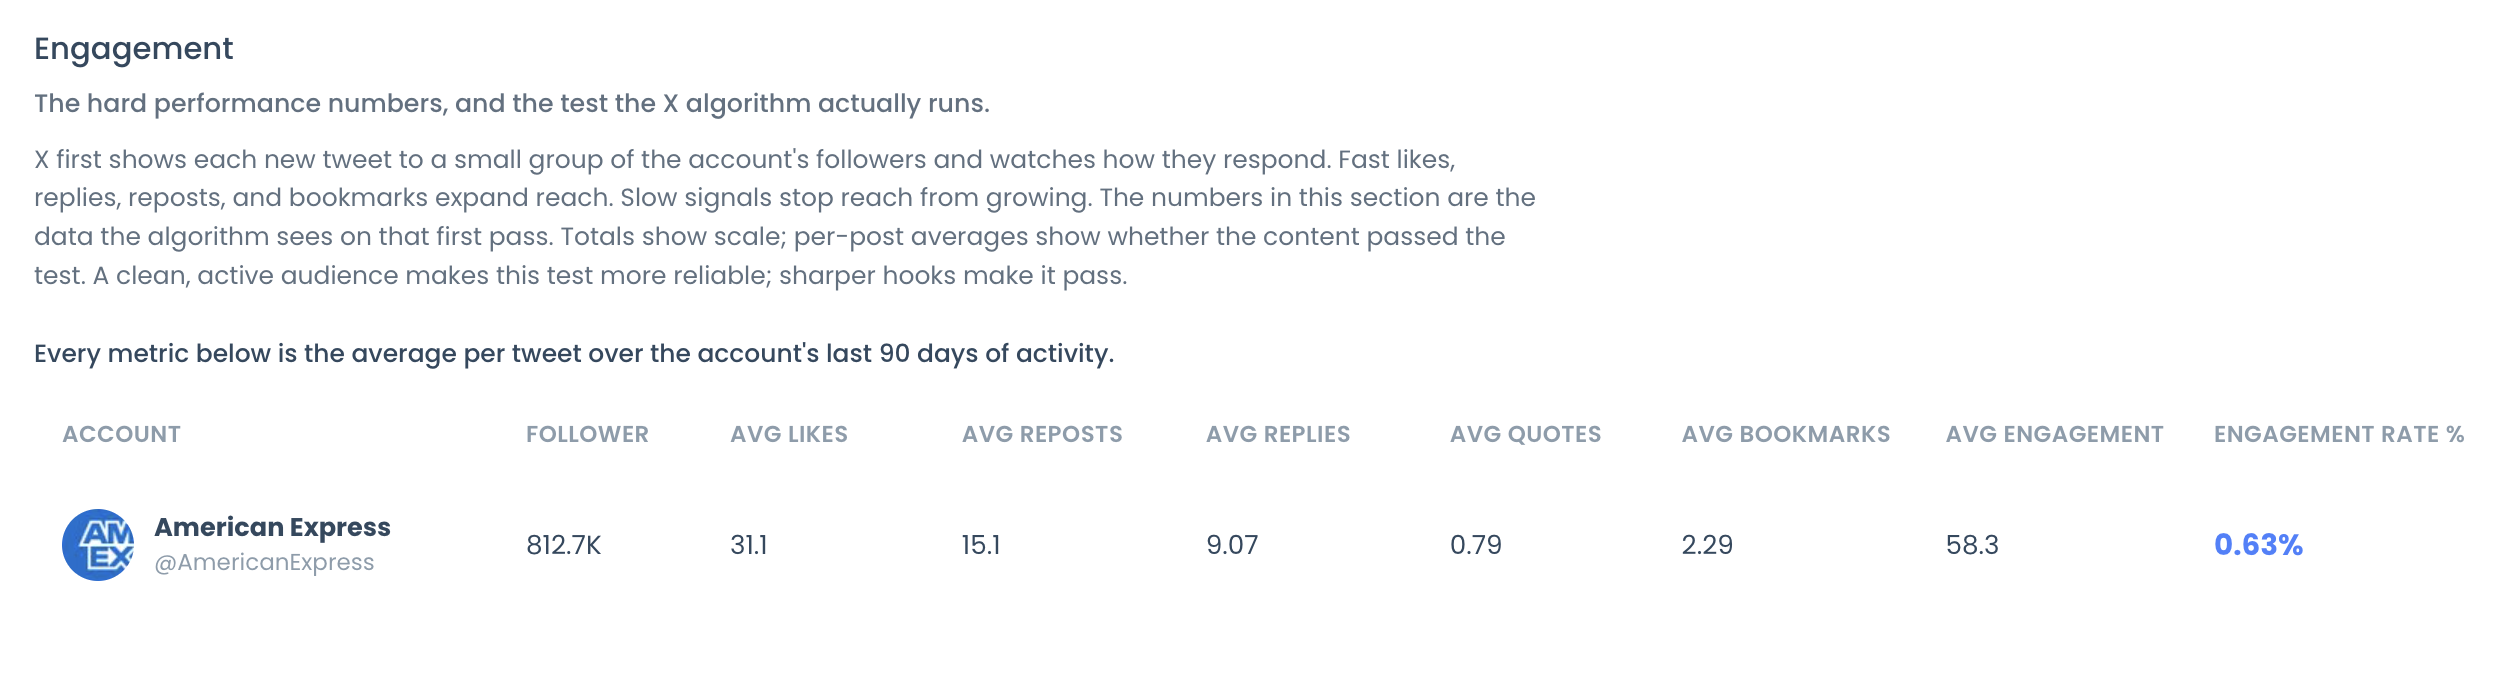
6. Engagement
Average likes, reposts, replies, quotes and bookmarks per tweet over your last 90 days, engagement rate and engagement over time.
7. Impression/Views
Total impressions over time and impressions over time.
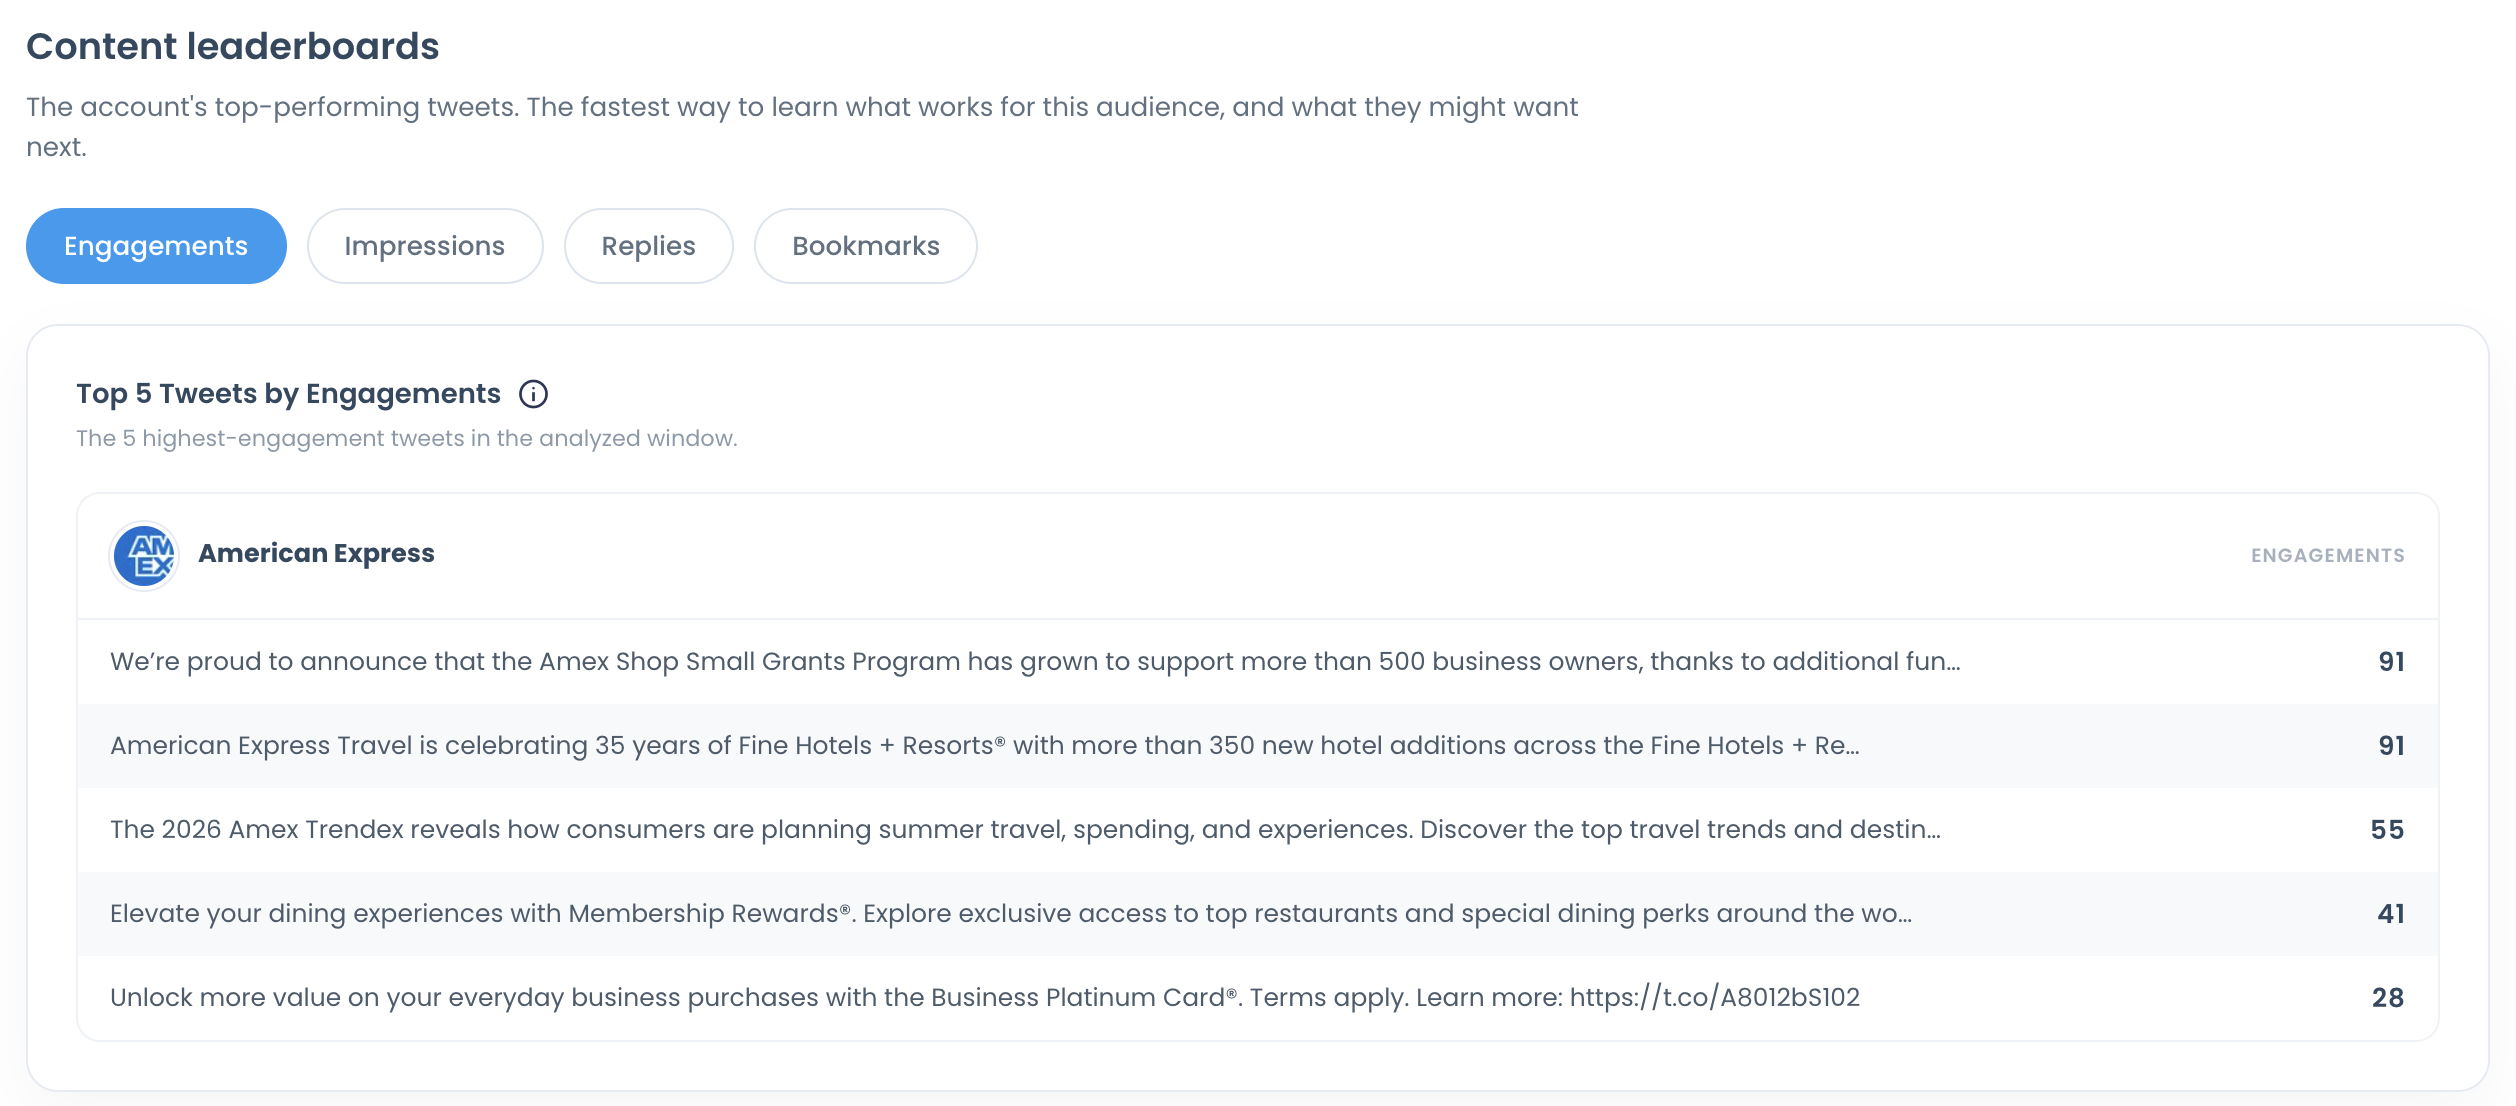
8. Content Leaderboards
Your top 5 tweets, with tabs for Engagements, Impressions, Replies and Bookmarks.
9. Video Performance
Video posting rate and video views.
Followers / Following toggle
The Followers / Following toggle switches the Audience Quality and Audience Demographics & Geography sections between your followers and the accounts you follow. Tweet-based sections stay the same in both views.