

What's included in the X Competitor Analysis report?
1. The essentials at a glance
Followers, following, active followers, account age, engagement rate and average impressions for each account.
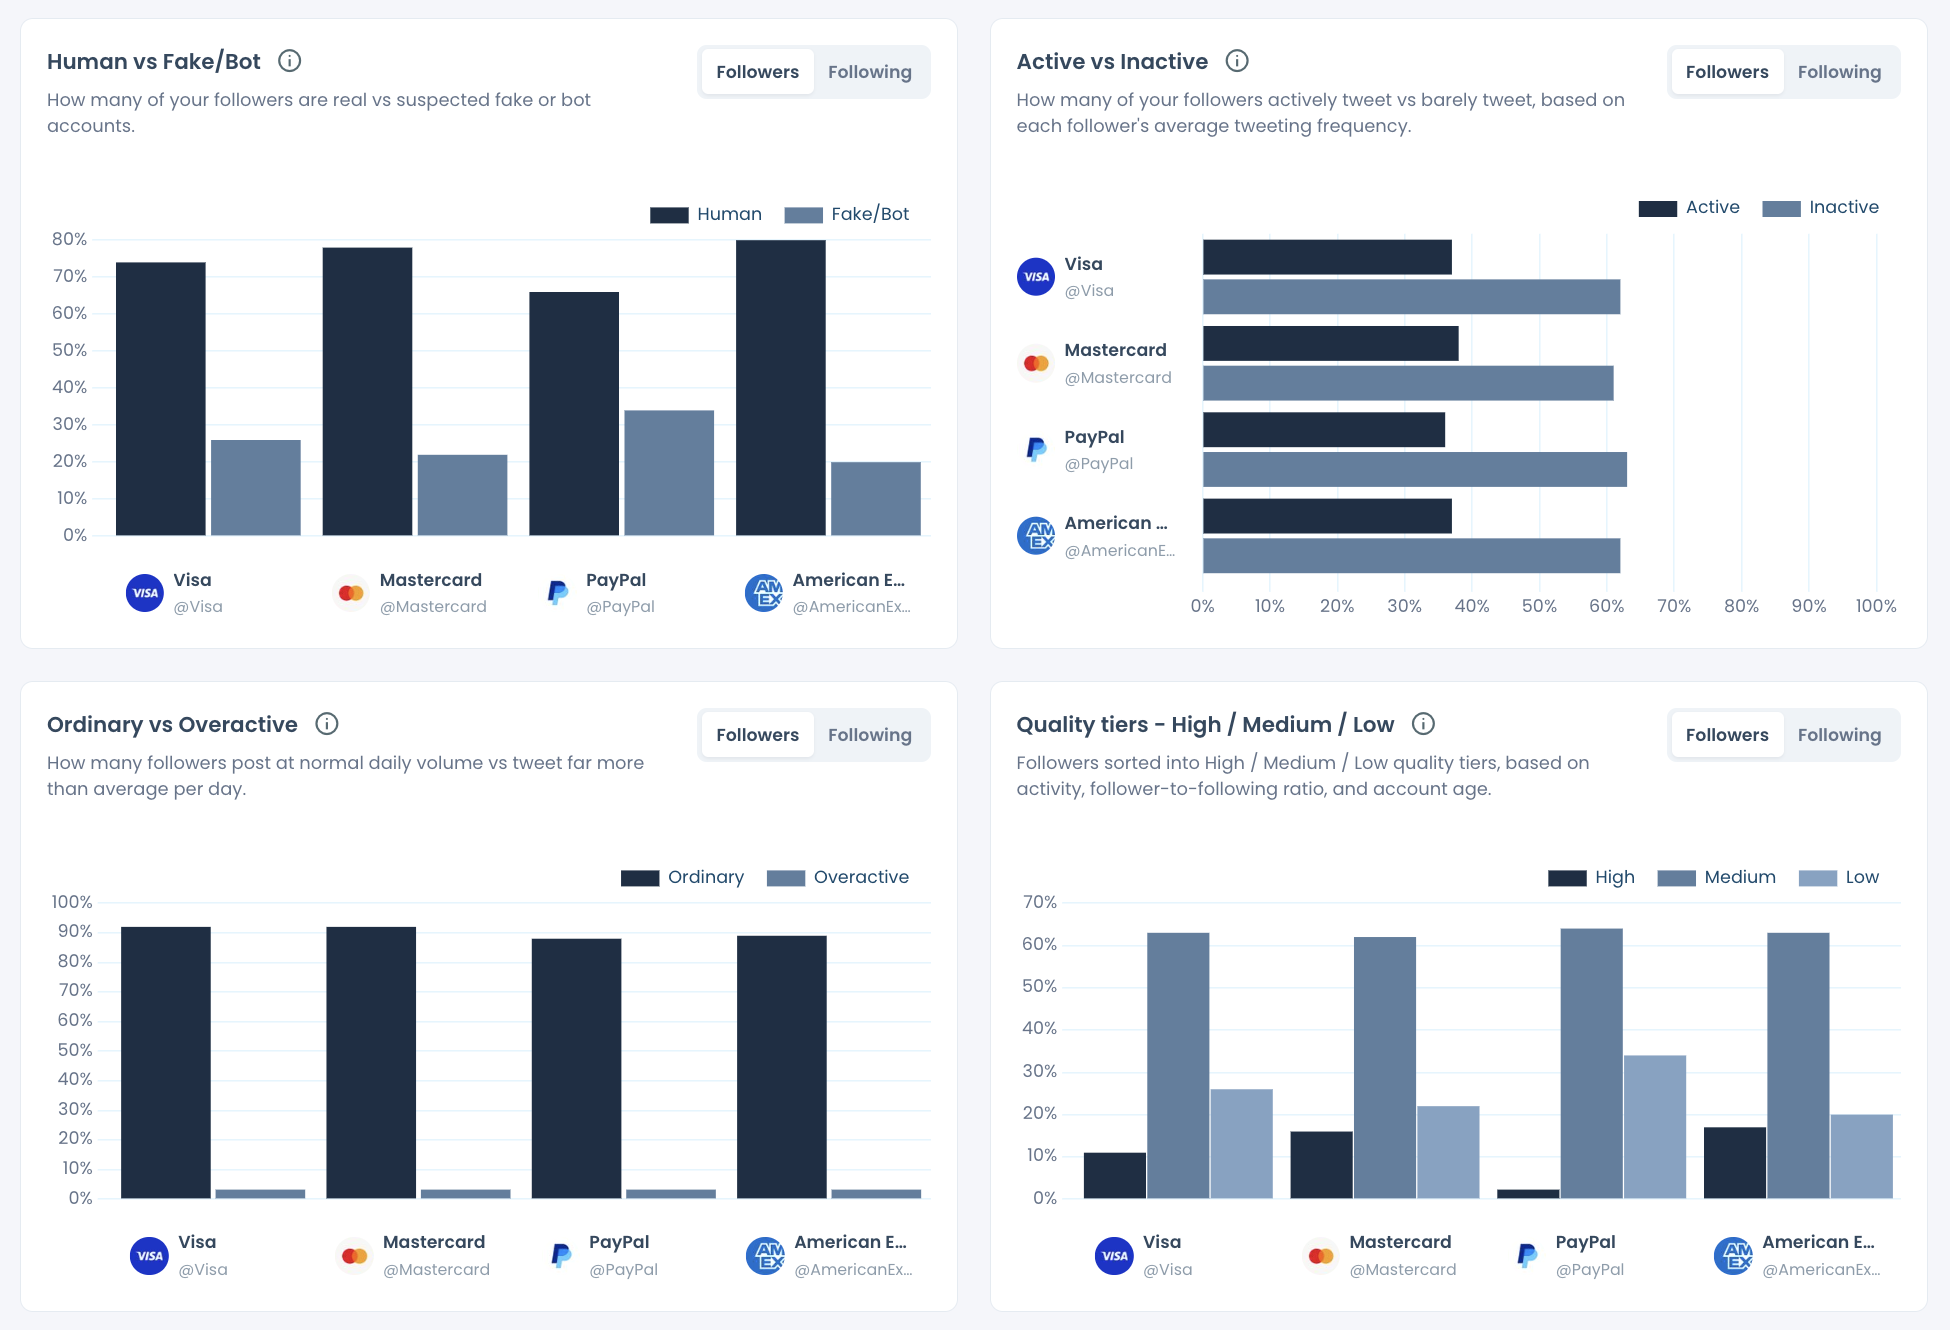
2. Audience Quality
Human vs Fake/Bot, Active vs Inactive, Ordinary vs Overactive, verified followers by Blue, Gold and Gray badge, and quality tiers (High, Medium, Low). You can also open the accounts behind the numbers: Fake/Bot, Overactive, Inactive, Egghead and Verified.
3. Audience Demographics & Geography
Geographic distribution, time zones, languages, gender, audience active times and audience bio keywords. The Common Audience section shows how many followers and followings two accounts share.
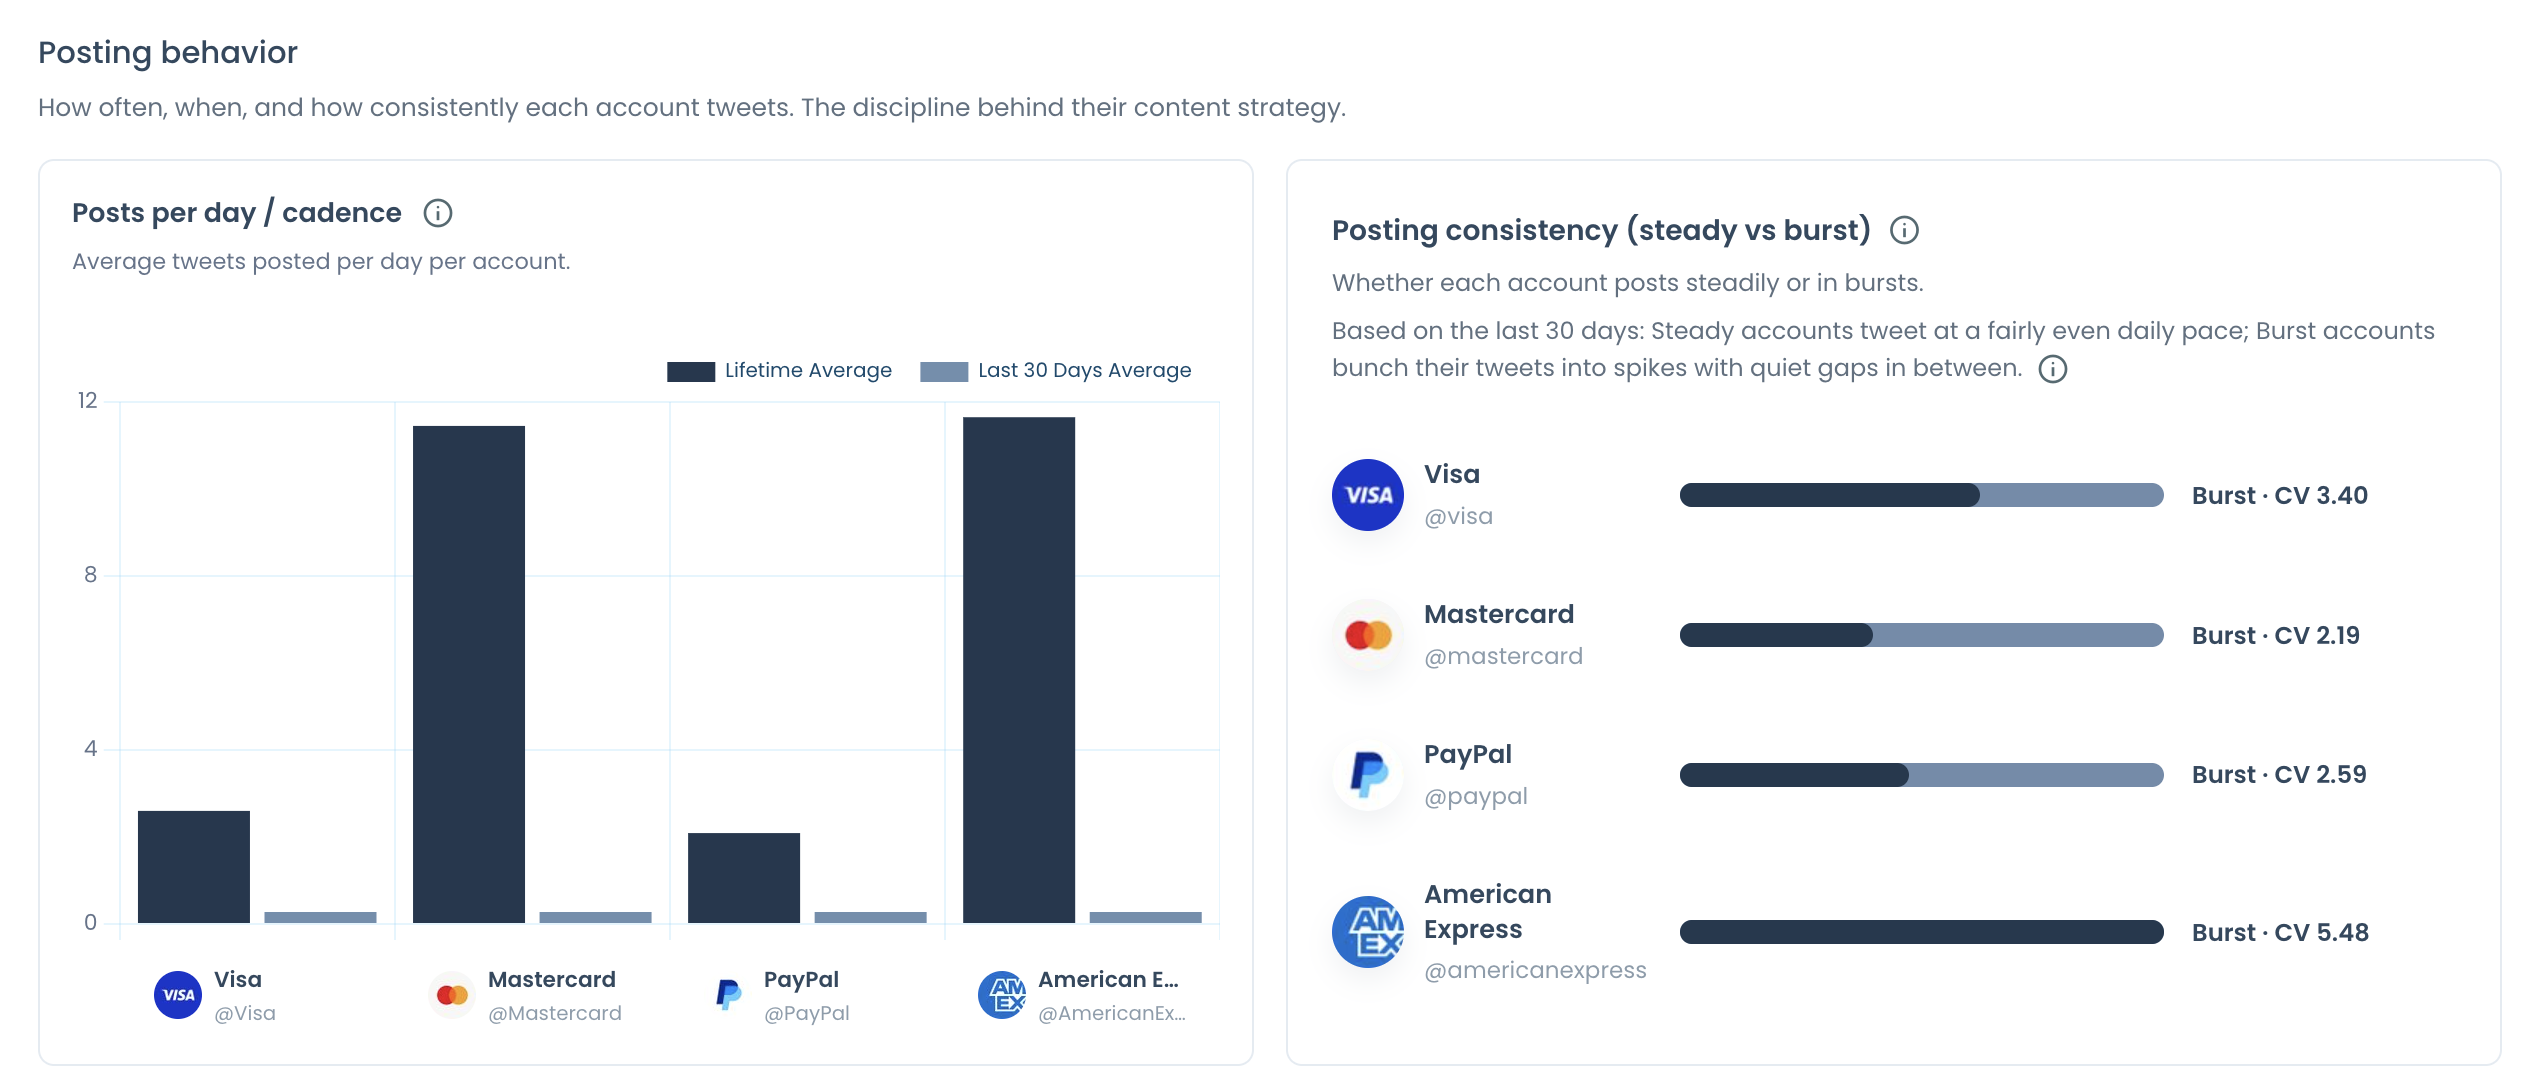
4. Posting Behavior
Posts per day (Lifetime Average and Last 30 Days Average), posting consistency, posting time-of-day pattern, average post length and posting-vs-audience timing alignment.
5. Content Type & Format
Post format distribution, top-performing format, the Original / Reply / RT / Quote mix, link and media share, and average hashtags per 500 tweets.
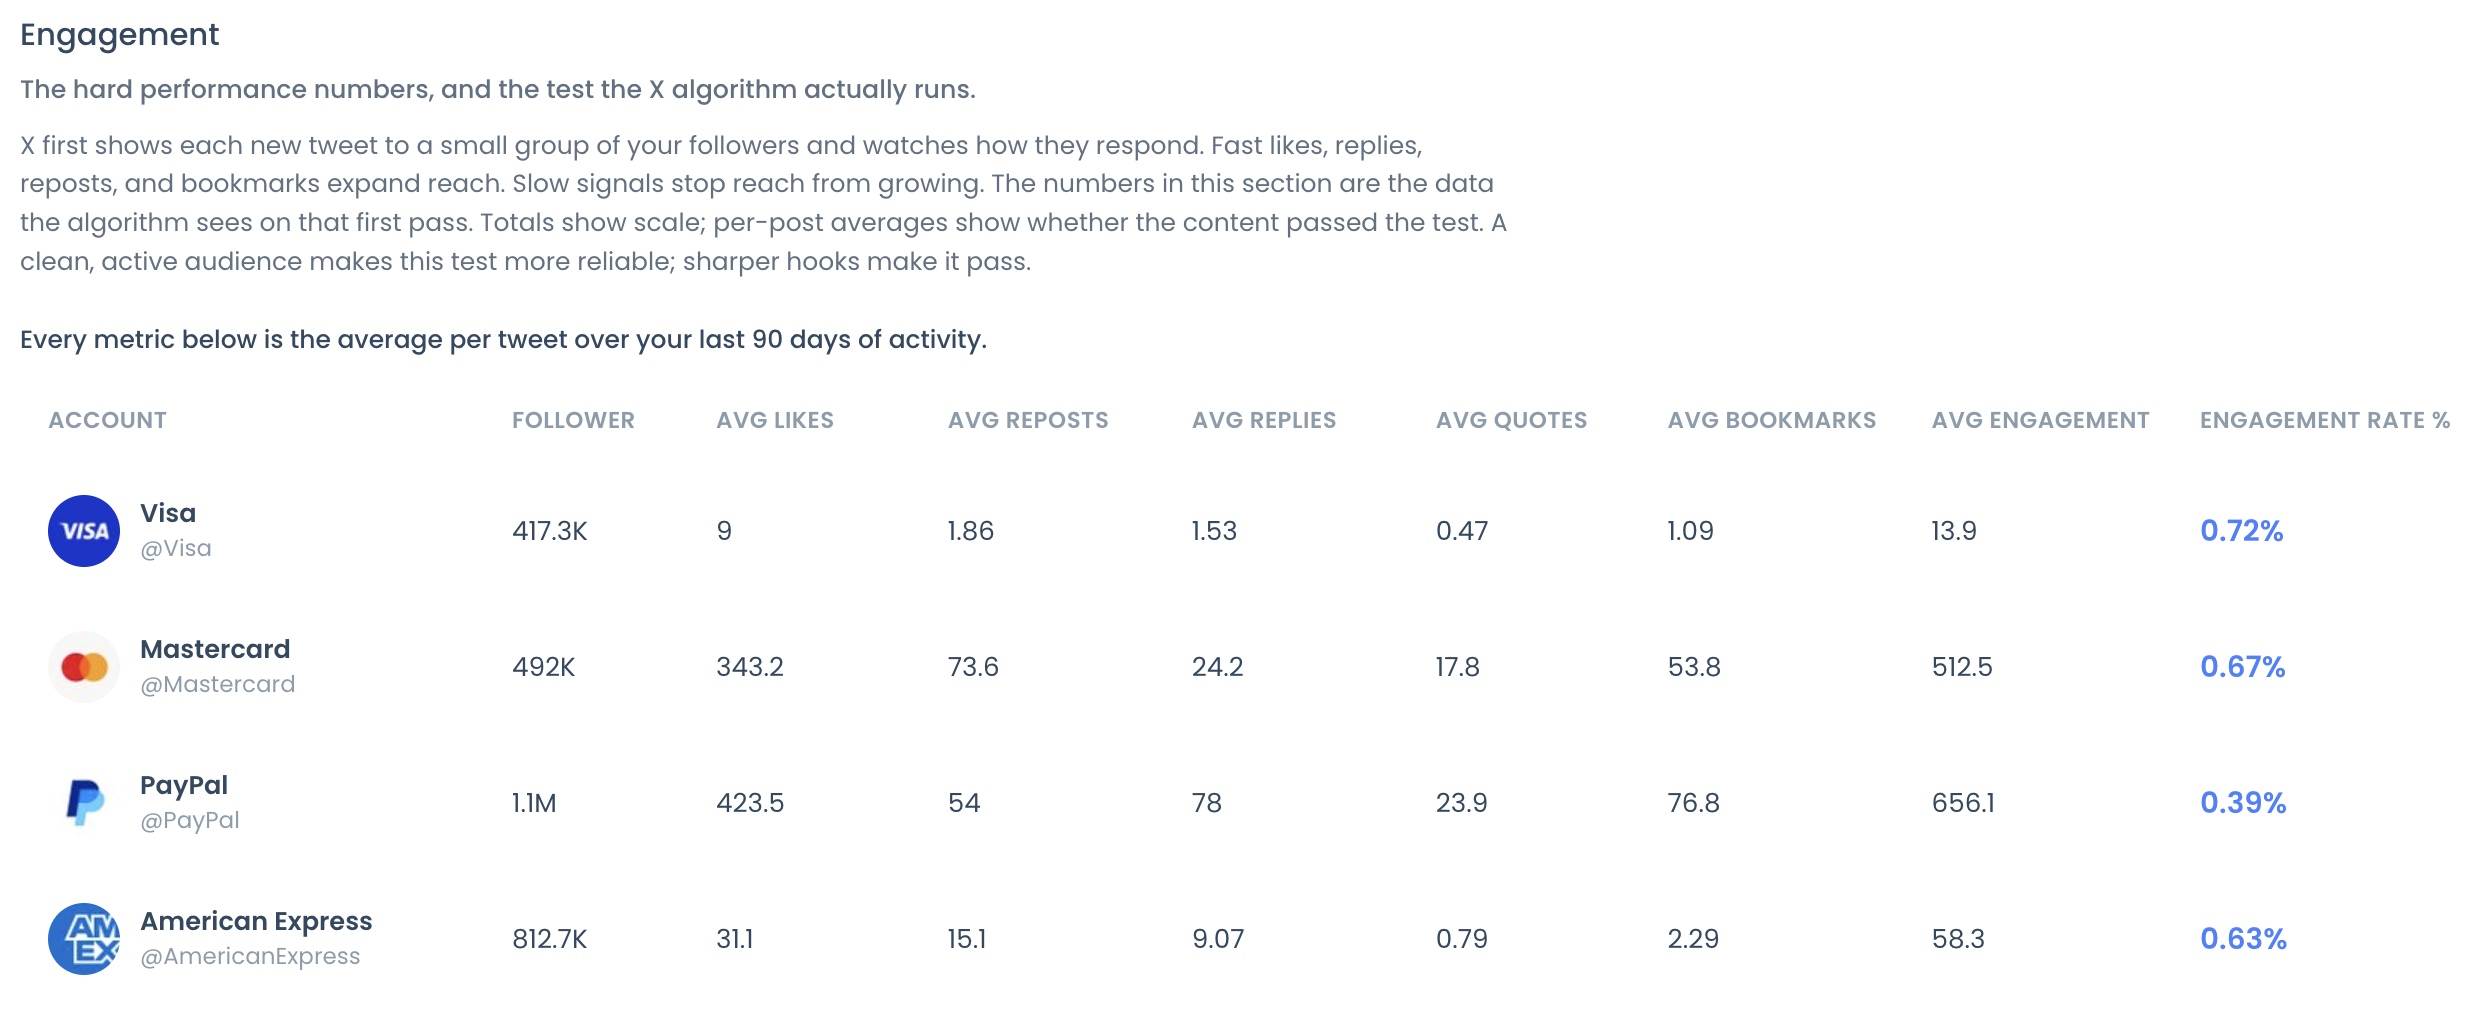
6. Engagement
Average likes, reposts, replies, quotes and bookmarks per tweet, engagement rate, and engagement over time.
7. Impression/Views
Total impressions over time and average impressions per tweet over time.
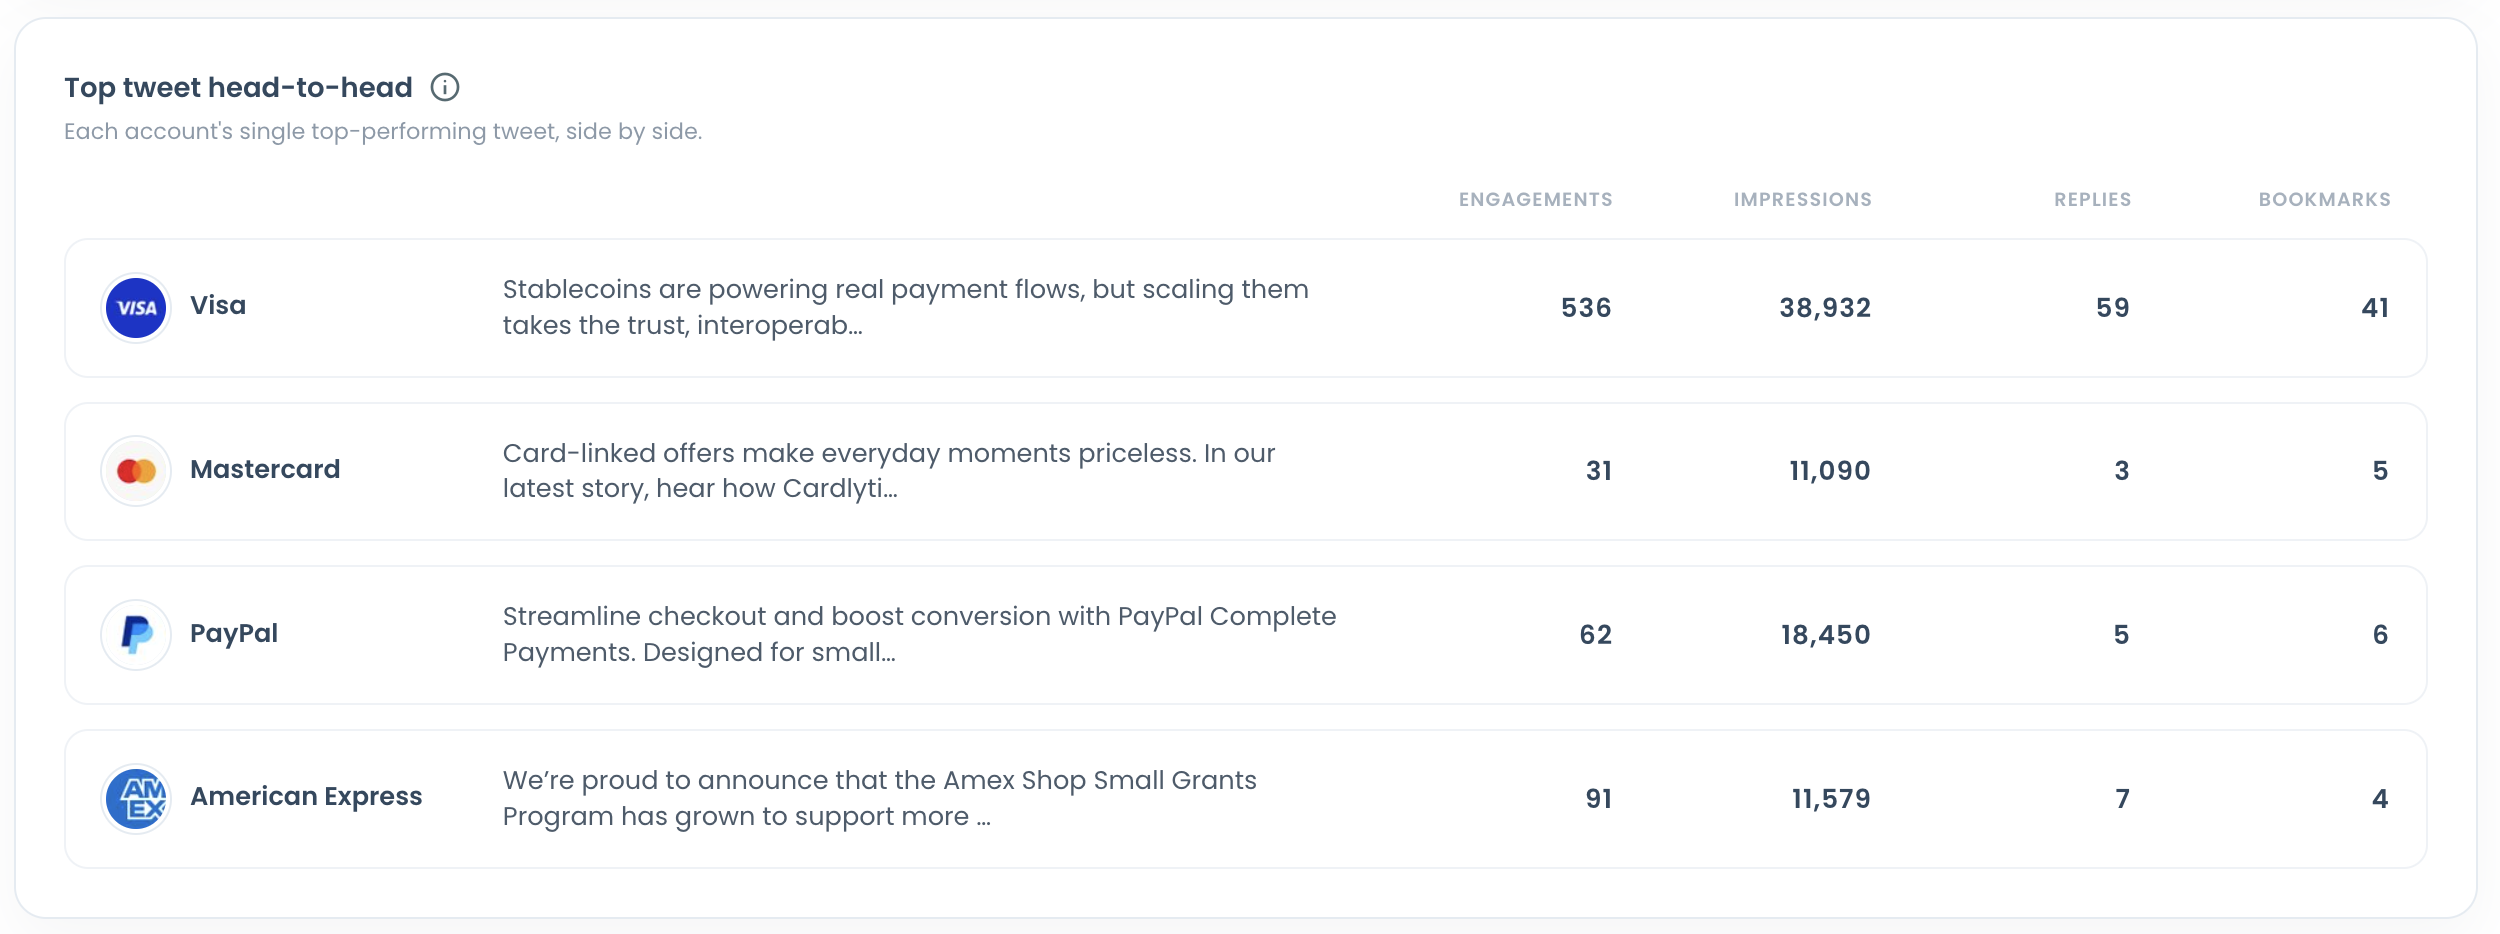
8. Content Leaderboards
Top 5 tweets by engagements, impressions, replies and bookmarks, the top tweet head-to-head and the bottom tweets (under-performers).
9. Video Performance
Video posting rate and total video views.
Followers / Following and Percentage / Values
The Followers / Following toggle switches the Audience Quality and Audience Demographics & Geography sections between each account's followers and the accounts it follows. Tweet-based sections stay the same in both views. The Percentage / Values toggle switches charts between percentages and numbers.
What's not in the report?
Metrics that only an account owner can see, such as profile visits, URL clicks and video retention, are not shown for any account, including your own. This way, every column compares the same data. You can review these metrics for your own account in Post Analytics.